Demo 4: Extracting activation functions
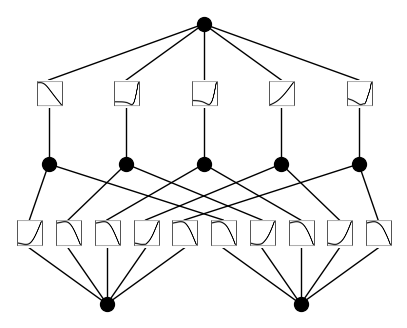
The KAN diagrams give intuitive illustration, but sometimes we may also want to extract the values of activation functions for more quantitative tasks. Using the indexing convention introduced in the indexing notebook, each edge is indexed as \((l,i,j)\), where \(l\) is the layer index, \(i\) is the input neuron index, and \(j\) is output neuron index.
from kan import *
import matplotlib.pyplot as plt
# create a KAN: 2D inputs, 1D output, and 5 hidden neurons. cubic spline (k=3), 5 grid intervals (grid=5).
model = KAN(width=[2,5,1], grid=5, k=3, seed=0, noise_scale_base = 1.0)
x = torch.normal(0,1,size=(100,2))
model(x)
model.plot(beta=100)
l = 1
i = 2
j = 0

inputs = model.spline_preacts[l][:,j,i]
outputs = model.spline_postacts[l][:,j,i]
# they are not ordered yet
rank = np.argsort(inputs)
inputs = inputs[rank]
outputs = outputs[rank]
plt.plot(inputs, outputs, marker="o")
[<matplotlib.lines.Line2D at 0x7fa93e7676a0>]
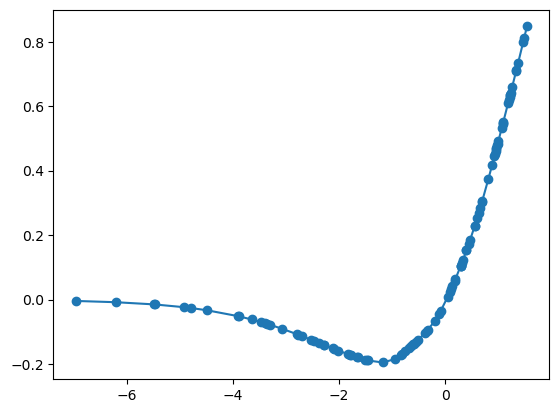
If we are interested in the range of some activation function, we can use get_range.
model.get_range(l,i,j)
x range: [-6.95 , 1.54 ]
y range: [-0.20 , 0.85 ]
(tensor(-6.9550), tensor(1.5376), tensor(-0.1954), tensor(0.8475))