Interpretability 9: Different plotting metrics
from kan import *

device = torch.device('cuda' if torch.cuda.is_available() else 'cpu')
print(device)

model = KAN(width=[2,5,1], device=device)
f = lambda x: torch.exp(torch.sin(torch.pi*x[:,[0]]) + x[:,[1]]**2)
dataset = create_dataset(f, n_var=2, device=device)
model.fit(dataset, steps = 20, lamb=1e-3);
cuda
checkpoint directory created: ./model
saving model version 0.0
| train_loss: 1.48e-02 | test_loss: 1.53e-02 | reg: 7.01e+00 | : 100%|█| 20/20 [00:04<00:00, 4.64it
saving model version 0.1
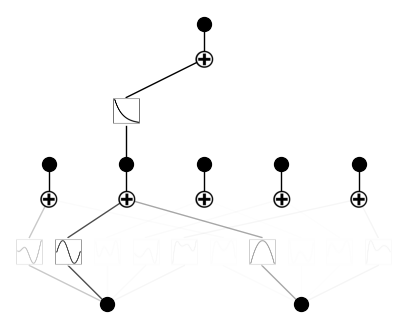
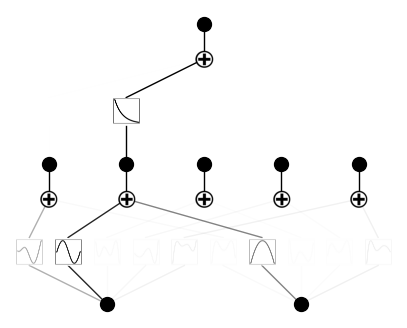
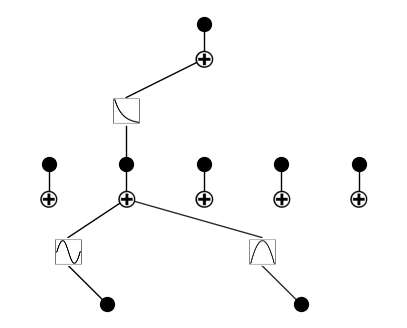
Note: To plot the KAN diagram, there are also three options * forward_u: the “norm” of edge, normalized (output std/input std) * forward_n: the “norm” of edge, unnormalized (output std) * backward: the edge attribution score (default)
model.plot(metric='forward_u')

model.plot(metric='forward_n')

model.plot(metric='backward')
