Example 13: Phase transition
In this example, we will use KAN to learn phase transitions in data. Phase transition is an important concept in science. We consider a toy example \(f(x_1,x_2,x_3)\) is 1 if \(g(x_1,x_2,x_3)>0\), and is 0 if \(g(x_1,x_2,x_3)<0\). \(g(x_1,x_2,x_3)={\rm sin}(\pi x_1)+{\rm cos}(\pi x_2)+{\rm tan}(\frac{\pi}{2}x_3)\).
Intialize model and create dataset
from kan import KAN, create_dataset
import torch


model = KAN(width=[3,1,1], grid=3, k=3)

# create dataset
f = lambda x: (torch.sin(torch.pi*x[:,[0]]) + torch.cos(torch.pi*x[:,[1]]) + torch.tan(torch.pi/2*x[:,[2]]) > 0).float()
dataset = create_dataset(f, n_var=3)
torch.mean(dataset['train_label'])
tensor(0.4870, dtype=torch.float32)
model(dataset['train_input'])
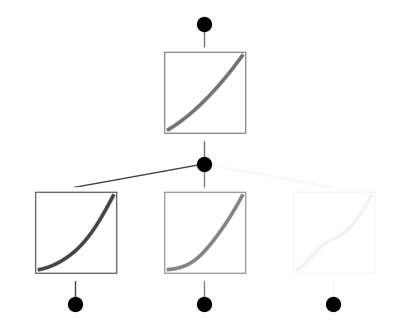
model.plot(beta=10)

# set the last activation to be sigmoid
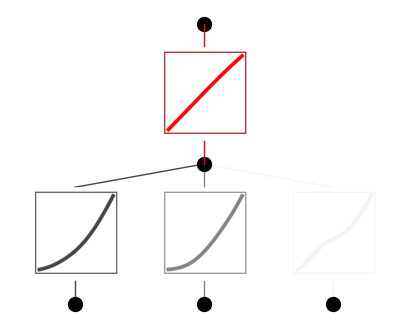
model.fix_symbolic(1,0,0,'sigmoid',fit_params_bool=False)
model(dataset['train_input'])
model.plot(beta=10)

model.train(dataset, opt="LBFGS", steps=50, lamb=0.001, lamb_entropy=10.);
train loss: 5.92e-02 | test loss: 9.67e-02 | reg: 7.76e+00 : 100%|██| 50/50 [00:08<00:00, 5.79it/s]
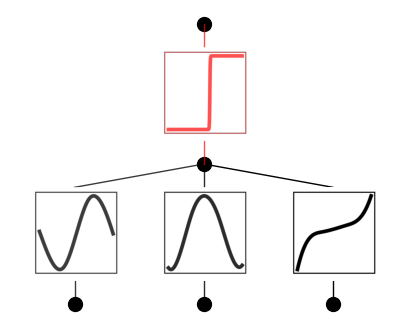
model.plot(beta=10)
