Community 1: Physics-informed KAN
Disclaimer: This is uploaded from a github user, not the KAN authors. KAN authors did not writer this or proofread this carefully, hence are not responsible for mistakes in this notebook. If you have questions, please consult the github user who uploaded it. Thank you!
import torch
from torch import autograd
from torch.utils.tensorboard import SummaryWriter
from tqdm import tqdm
import matplotlib.pyplot as plt
from kan import KAN, LBFGS
device = torch.device("cpu")
print("Using device:", device)
rho = torch.tensor(1.0, device=device, requires_grad=False)
nu = torch.tensor(0.01, device=device, requires_grad=False)
eps = torch.tensor(1e-8, device=device, requires_grad=False)
width, height = 10.0, 2.0
num_points_x, num_points_y = 100, 20
x = torch.linspace(0, width, num_points_x, device=device, requires_grad=False)
y = torch.linspace(0, height, num_points_y, device=device, requires_grad=False)
X, Y = torch.meshgrid(x, y, indexing='ij')
coordinates = torch.stack([X.flatten(), Y.flatten()], dim=1).to(device)
coordinates.requires_grad = True # Ensure coordinates require grad
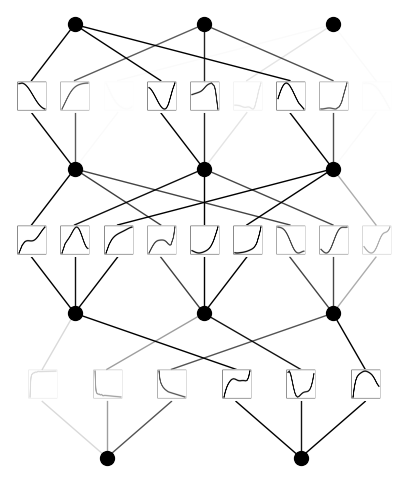
model = KAN(width=[2,3,3, 3], grid=5, k=10, grid_eps=1.0,
noise_scale_base=0.25).to(device)
def batch_jacobian(func, x, create_graph=False):
def _func_sum(x):
return func(x).sum(dim=0)
return autograd.functional.jacobian(_func_sum, x, create_graph=create_graph).permute(1, 0, 2)
def batch_hessian(func, x):
jacobian = batch_jacobian(func, x, create_graph=True)
hessians = []
for i in range(jacobian.size(1)):
grad = autograd.grad(jacobian[:, i].sum(), x, create_graph=True, retain_graph=True)[0]
hessians.append(grad.unsqueeze(1))
return torch.cat(hessians, dim=1)
def navier_stokes_residuals(coords):
coords = coords.clone().detach().requires_grad_(True) # Ensure coords require grad
y_pred = model(coords)
grads = batch_jacobian(model, coords, create_graph=True)
hessians = batch_hessian(model, coords)
u, v, p = y_pred[:, 0], y_pred[:, 1], y_pred[:, 2]
u_x, u_y = grads[:, 0, 0], grads[:, 0, 1]
v_x, v_y = grads[:, 1, 0], grads[:, 1, 1]
p_x, p_y = grads[:, 2, 0], grads[:, 2, 1]
u_xx, u_yy = hessians[:, 0, 0], hessians[:, 0, 1]
v_xx, v_yy = hessians[:, 1, 0], hessians[:, 1, 1]
continuity = u_x + v_y + eps * p
x_momentum = u * u_x + v * u_y + (1 / rho) * p_x - nu * (u_xx + u_yy)
y_momentum = u * v_x + v * v_y + (1 / rho) * p_y - nu * (v_xx + v_yy)
no_slip_mask = (coords[:, 1] == 0) | (coords[:, 1] == height)
inlet_mask = (coords[:, 0] == 0)
outlet_mask = (coords[:, 0] == width)
no_slip_loss = torch.mean(u[no_slip_mask] ** 2 + v[no_slip_mask] ** 2)
inlet_loss = torch.mean((u[inlet_mask] - 1) ** 2)
outlet_pressure_loss = torch.mean(p[outlet_mask] ** 2)
bc_loss = no_slip_loss + inlet_loss + outlet_pressure_loss
total_loss = torch.mean(continuity ** 2 + x_momentum ** 2 + y_momentum ** 2) + bc_loss
return total_loss
writer = SummaryWriter()
def train():
optimizer = LBFGS(model.parameters(), lr=1,
history_size=10, line_search_fn="strong_wolfe", tolerance_grad=1e-32, tolerance_change=1e-32, tolerance_ys=1e-32)
steps = 200 # 20 steps are enough
pbar = tqdm(range(steps), desc='Training Progress')
for step in pbar:
def closure():
optimizer.zero_grad()
loss = navier_stokes_residuals(coordinates)
loss.backward()
return loss
optimizer.step(closure)
if step % 5 == 0:
current_loss = closure().item()
pbar.set_description("Step: %d | Loss: %.3f" %
(step, current_loss))
writer.add_scalar('Loss/train', current_loss, step)
train()
writer.close()
Using device: cpu
Step: 195 | Loss: 0.011: 100%|██████████| 200/200 [2:52:51<00:00, 51.86s/it]
u_pred = model(coordinates)[:, 0].detach().reshape(
num_points_x, num_points_y).T
v_pred = model(coordinates)[:, 1].detach().reshape(
num_points_x, num_points_y).T
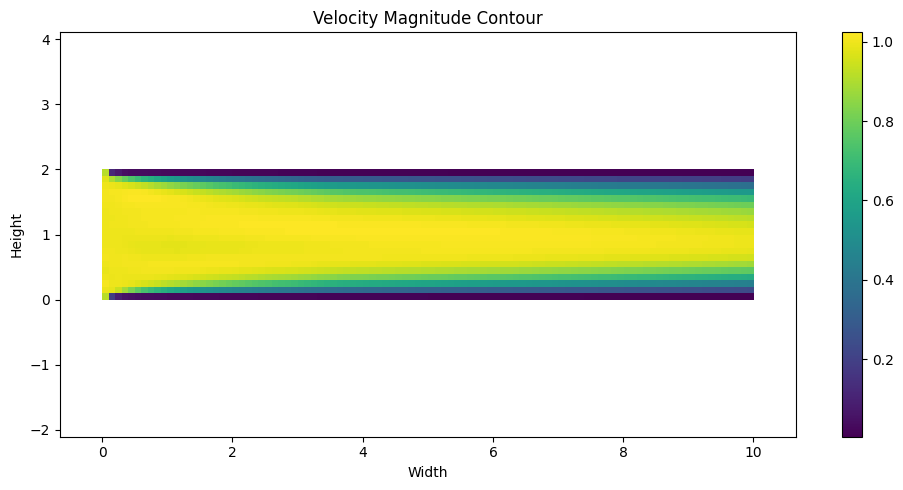
magnitude = torch.sqrt(u_pred ** 2 + v_pred ** 2)
plt.figure(figsize=(10, 5)) # Set the figure size as needed
plt.imshow(magnitude, extent=(0, width, 0, height), origin='lower', cmap='viridis')
plt.colorbar() # Add a colorbar to show the magnitude scale
plt.title('Velocity Magnitude Contour')
plt.xlabel('Width')
plt.ylabel('Height')
plt.axis('equal') # Ensure the plot has equal scaling
plt.tight_layout() # Adjust layout to prevent overlap
plt.show()
# Extracting predictions
u_pred = model(coordinates)[:, 0].detach().reshape(num_points_x, num_points_y).T
v_pred = model(coordinates)[:, 1].detach().reshape(num_points_x, num_points_y).T
p_pred = model(coordinates)[:, 2].detach().reshape(num_points_x, num_points_y).T
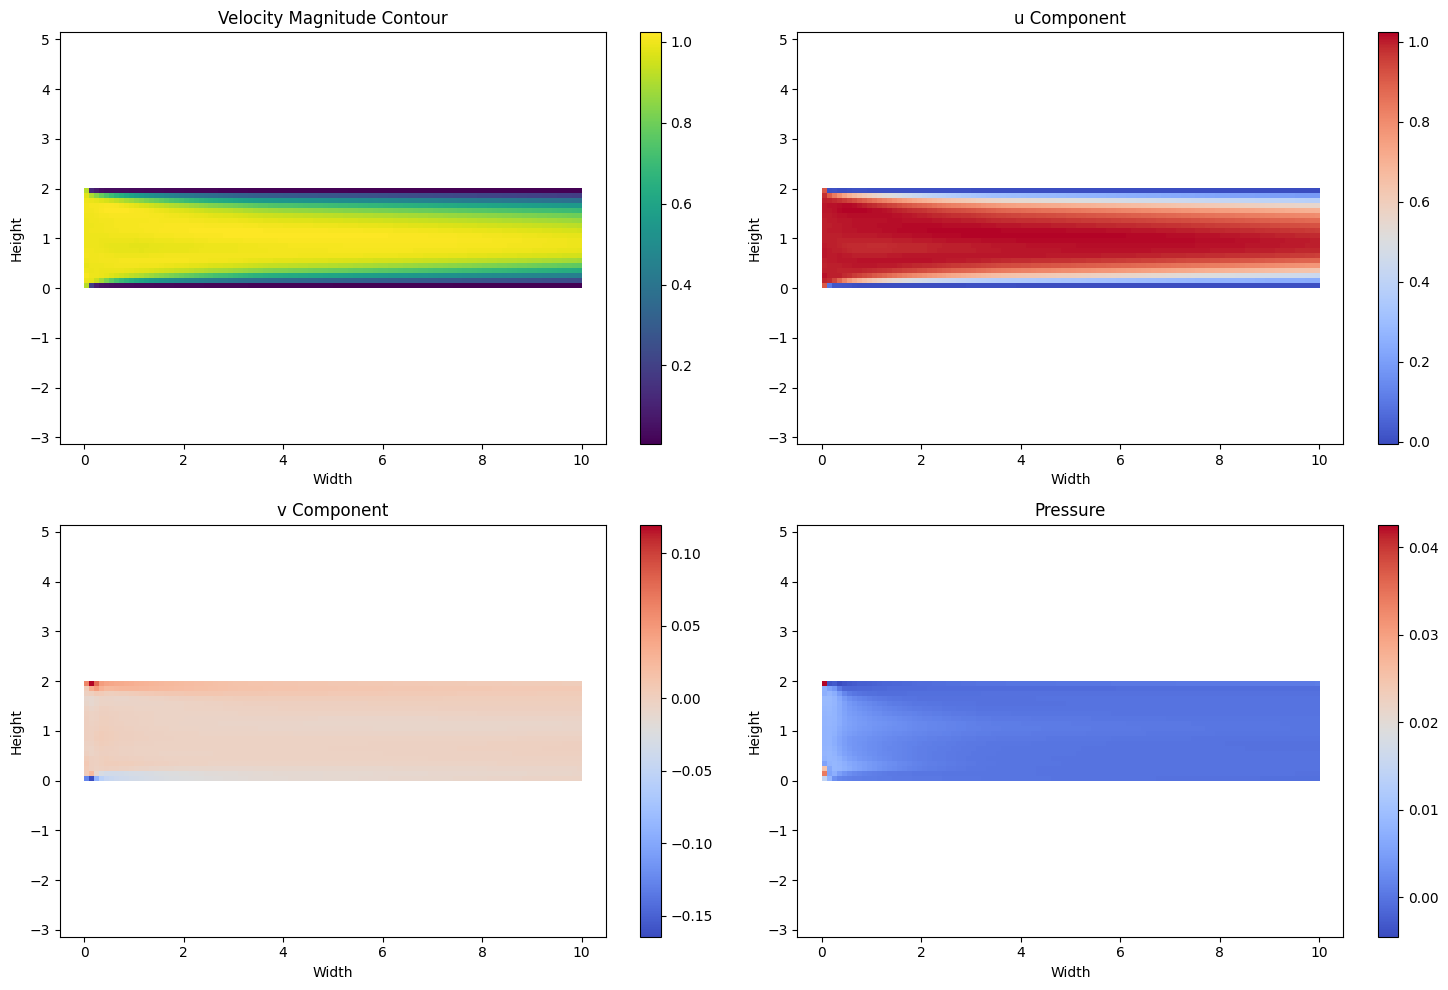
# Velocity Magnitude
magnitude = torch.sqrt(u_pred ** 2 + v_pred ** 2)
# Plotting all subplots
fig, axs = plt.subplots(2, 2, figsize=(15, 10))
# Velocity Magnitude
im0 = axs[0, 0].imshow(magnitude, extent=(0, width, 0, height), origin='lower', cmap='viridis')
fig.colorbar(im0, ax=axs[0, 0])
axs[0, 0].set_title('Velocity Magnitude Contour')
axs[0, 0].set_xlabel('Width')
axs[0, 0].set_ylabel('Height')
axs[0, 0].axis('equal')
# u Component
im1 = axs[0, 1].imshow(u_pred, extent=(0, width, 0, height), origin='lower', cmap='coolwarm')
fig.colorbar(im1, ax=axs[0, 1])
axs[0, 1].set_title('u Component')
axs[0, 1].set_xlabel('Width')
axs[0, 1].set_ylabel('Height')
axs[0, 1].axis('equal')
# v Component
im2 = axs[1, 0].imshow(v_pred, extent=(0, width, 0, height), origin='lower', cmap='coolwarm')
fig.colorbar(im2, ax=axs[1, 0])
axs[1, 0].set_title('v Component')
axs[1, 0].set_xlabel('Width')
axs[1, 0].set_ylabel('Height')
axs[1, 0].axis('equal')
# Pressure
im3 = axs[1, 1].imshow(p_pred, extent=(0, width, 0, height), origin='lower', cmap='coolwarm')
fig.colorbar(im3, ax=axs[1, 1])
axs[1, 1].set_title('Pressure')
axs[1, 1].set_xlabel('Width')
axs[1, 1].set_ylabel('Height')
axs[1, 1].axis('equal')
plt.tight_layout() # Adjust layout to prevent overlap
plt.show()
model.plot(beta=10)